
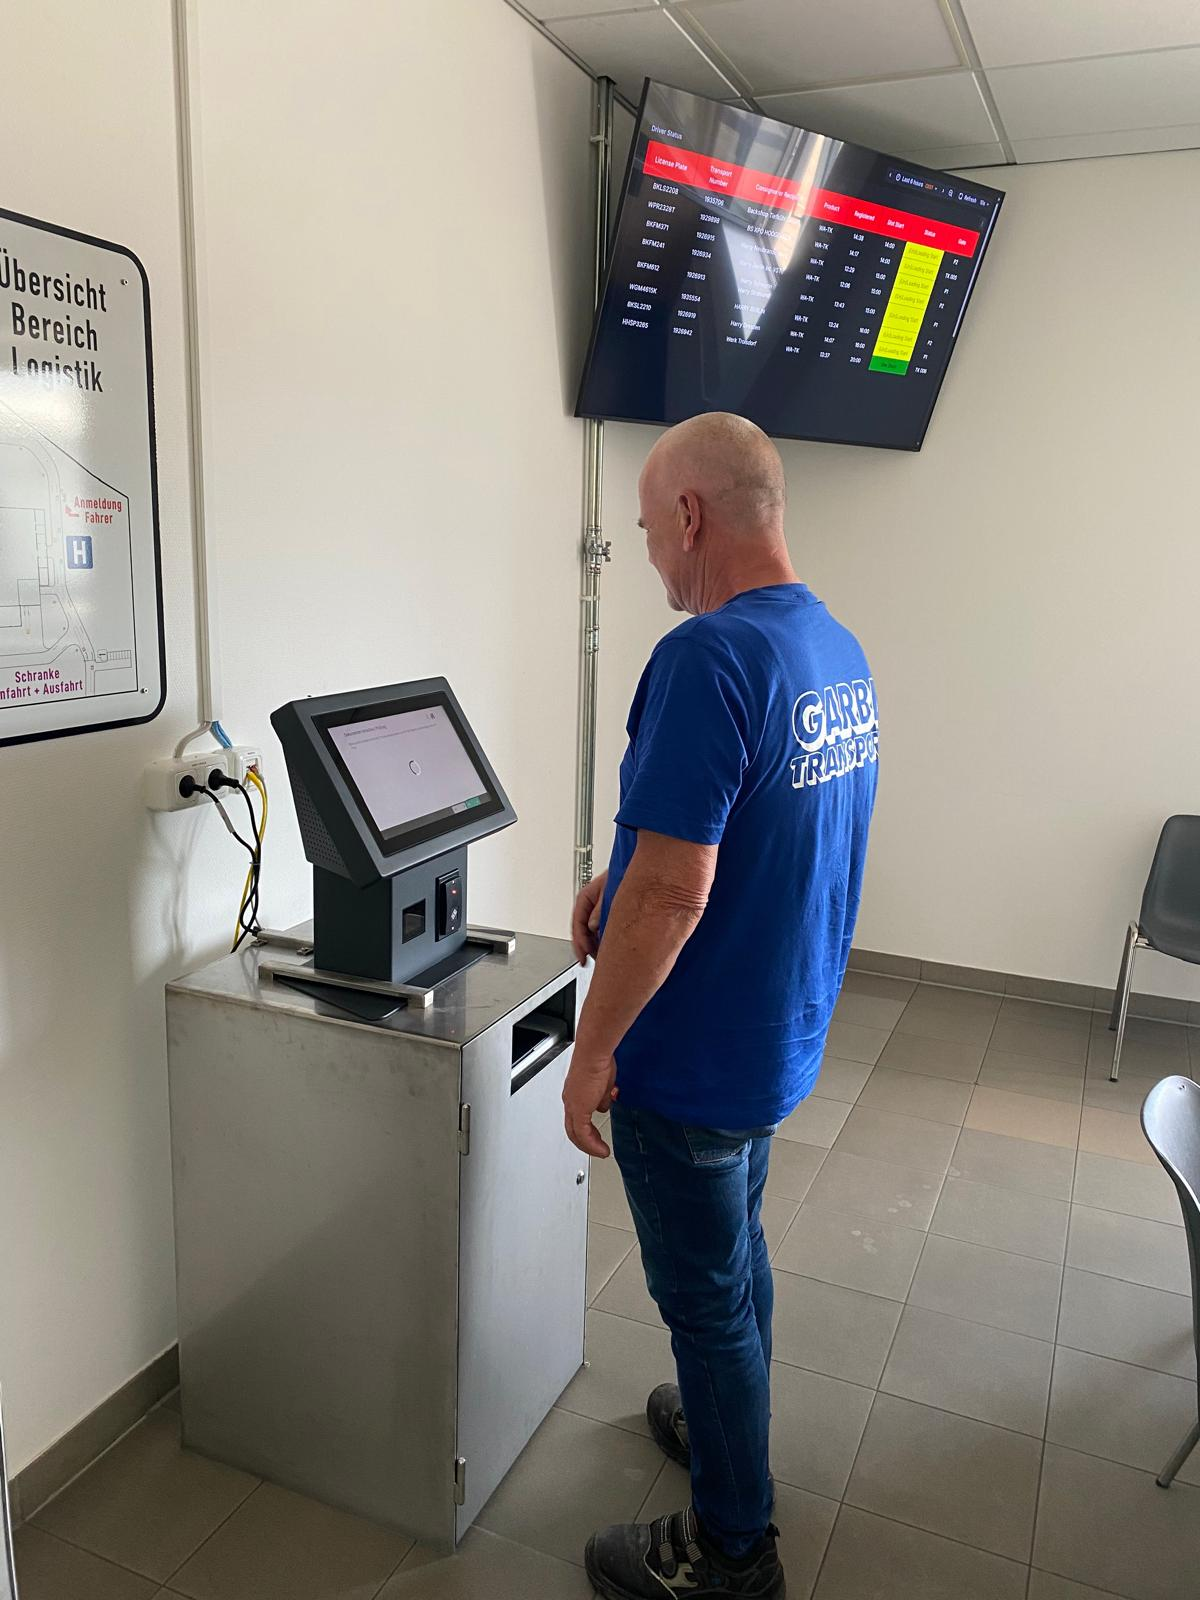
Yard Live Dashboards
When to use this?
When you want to monitor the progress of the day
How many trucks done today?
How many trucks remaining?
Which trucks will arrive within the next 30 minutes?
When you want to set expectations to the drivers
How many trucks in the queue?
What is the expected / average waiting time to dispatch?
When you want a view on anomalies
Which drivers who have been called off aren’t reacting?
Main idea
Create insightful reports, and have them displayed in the field or in the logistics office:

Report examples (can be shared for customer demo’s)
Show counters to track progress of the day
Show list of visitors on the parking
Show list of recently dispatch visitors
Show list of drivers that successfully registered, but not yet dispatched
Show list of drivers that are dispatched and should go to dock (but they are not yet onsite)
Supported components
If you need a new component that is not supported yet, please reach out to product to understand whether this can be added.
Limited to visitors from yesterday till tomorrow.
Only visitors with a validity between yesterday and tomorrow are in scope. Per component a more specific filter (e.g. only today) can be applied if desired.
All of the components can be filtered by a combination of status, site, location (onsite/offsite) and date (validity today or slot start today).
A table view of visitor, showing columns with relevant data.
A counter of the number of visitors in a certain filtered set.
A calculation of the average time on site for all visitors in a certain filtered set.
How does it work?
A secured web report is created by Peripass project services. The report is hosted on peripass.grafana.net and is accessible with username / password. The report makes use of the Peripass Public API and is able to refresh the results each 5 seconds:
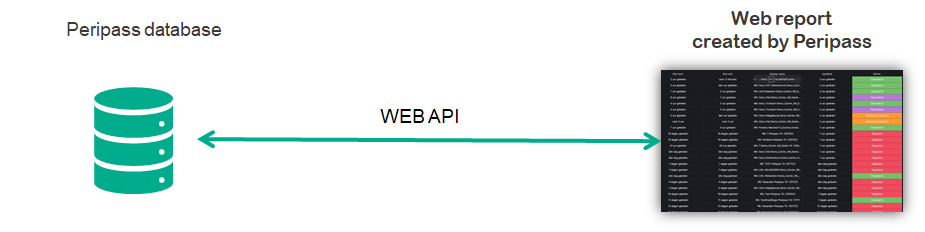
All communication happens in the cloud. No connections required to the customer’s local network.
Won’t do & limitations
Limitations of the report
Max 2 500 visitors per day
The Live Yard Dashboards is limited to 2 500 visitors. The queries cannot take more than 2 500 visitors in scope. Sites with more then 2 500 visitor per day, might be missing information.
There should be a way to query today’s visitors: different customers assign a validity of more than 1 day to visitors. Alternatively, they have a more accurate field to filter the visitors, such as Slot start.
Refresh interval: max 5sec, but recommended to 1 minute or higher
In theory, you can configure the dashboard to refresh every 5 seconds. However this generates a lot of traffic to our systems (and the customer is consuming API bandwidth that is constrained by rate limits). Recommended is to put the refresh interval on 1 minute or higher.
It is not possible to show any data visualisation you want. Please check the supported components listed above.
Limitations when connecting a computer to a TV-screen
The browser session will expire, requiring you to login every once in a while. The browser application can be configured to only expire after 1 year, meaning you will have to login into the report once per year.
The computer session might also expire and/or the PC might have to reboot every once in a while. Check with your internal IT to verify what is needed to reopen the report after a restart of the PC and how frequent login will be needed.
Limitations when connecting to digital signage platforms
If you want to display the secured report on your digital signage platform, your platform will need to have a connector to authenticate with Grafana in order to access and display the dashboards.
Example of such a connector and how it works with Screencloud can be found here.