
Reporting using Power BI
How to Install Power BI
Power BI, a powerful data visualization and reporting tool from Microsoft, is free to use for desktop users. To download Power BI Desktop, visit the official Microsoft download page: Power BI Desktop Download.
For optimal performance, it’s recommended to select the 64-bit version.
Start from the Peripass Power BI template
Download the template
The following Power BI template can be used to quickly generate a dashboard through the Peripass API:
Dashboard Peripass API v12.pbit
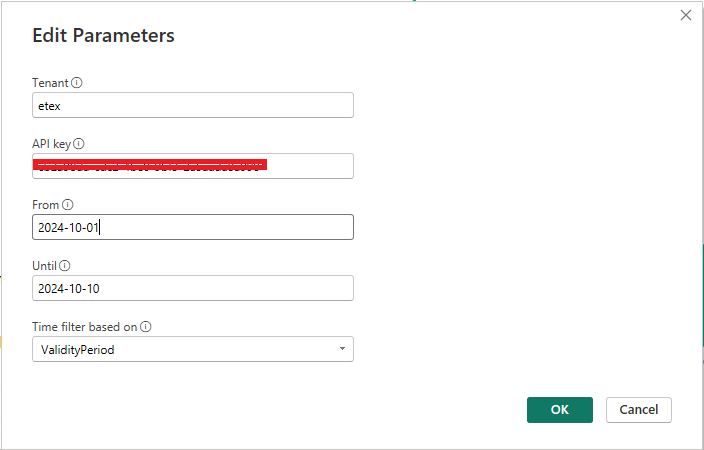
Enter the parameters
Upon opening this template, you’ll be prompted to provide the following details:
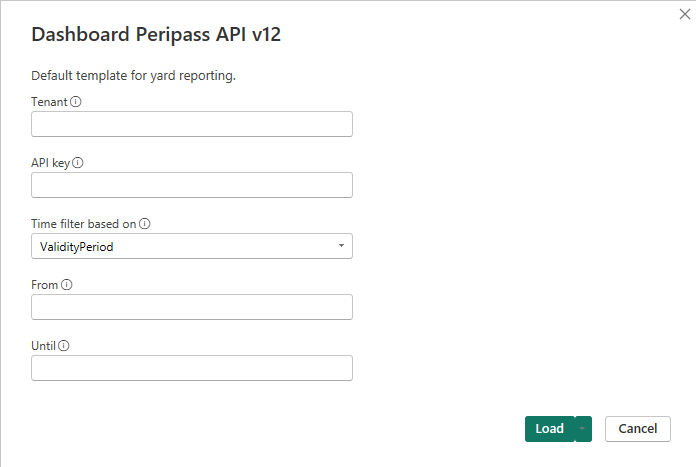
Tenant: Specify the tenant for which you want to create the dashboard.
E.g. for https://demo.peripass.app/ the tenant name is ‘demo’.
API Key: Enter the API key associated with the specified tenant.
Time filter based on
ValidityPeriod: Use this option if Slot Tracking is not used for all profiles that should be included in the report.
SlotStart: use this if slot tracking is used
From
Leave blank to default to 2 months ago.
To report from a specific date, use the appropriate format as defined below.
Until
Leave blank to default to today.
To report up to a specific date, use the appropriate format as defined below.
Accepted Date/Time Formats
ValidityPeriod format
Format:
YYYY-MM-DDExample:
2024-01-01
SlotStart format
Format:
YYYY-MM-DDTHH:MM:SS±HH:MMExample:
2024-10-08T00:00:00+02:00
Limit your reporting period!
The template can load a maximum of 15,000 visitors. If the reporting period is too broad or if many visitors have long validity periods, the report may be capped, potentially omitting some results within the selected timeframe.
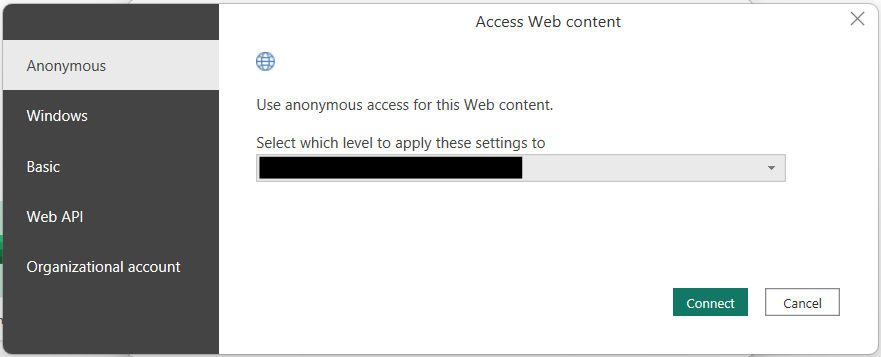
Connect and approve anonymous access to the data source
Note that you will have to click “Connect” on the dialog pictured below when using a tenant for the first time.
Start browsing your data
When that is done, your dashboard should automatically be populated with the relevant data and look something like this:
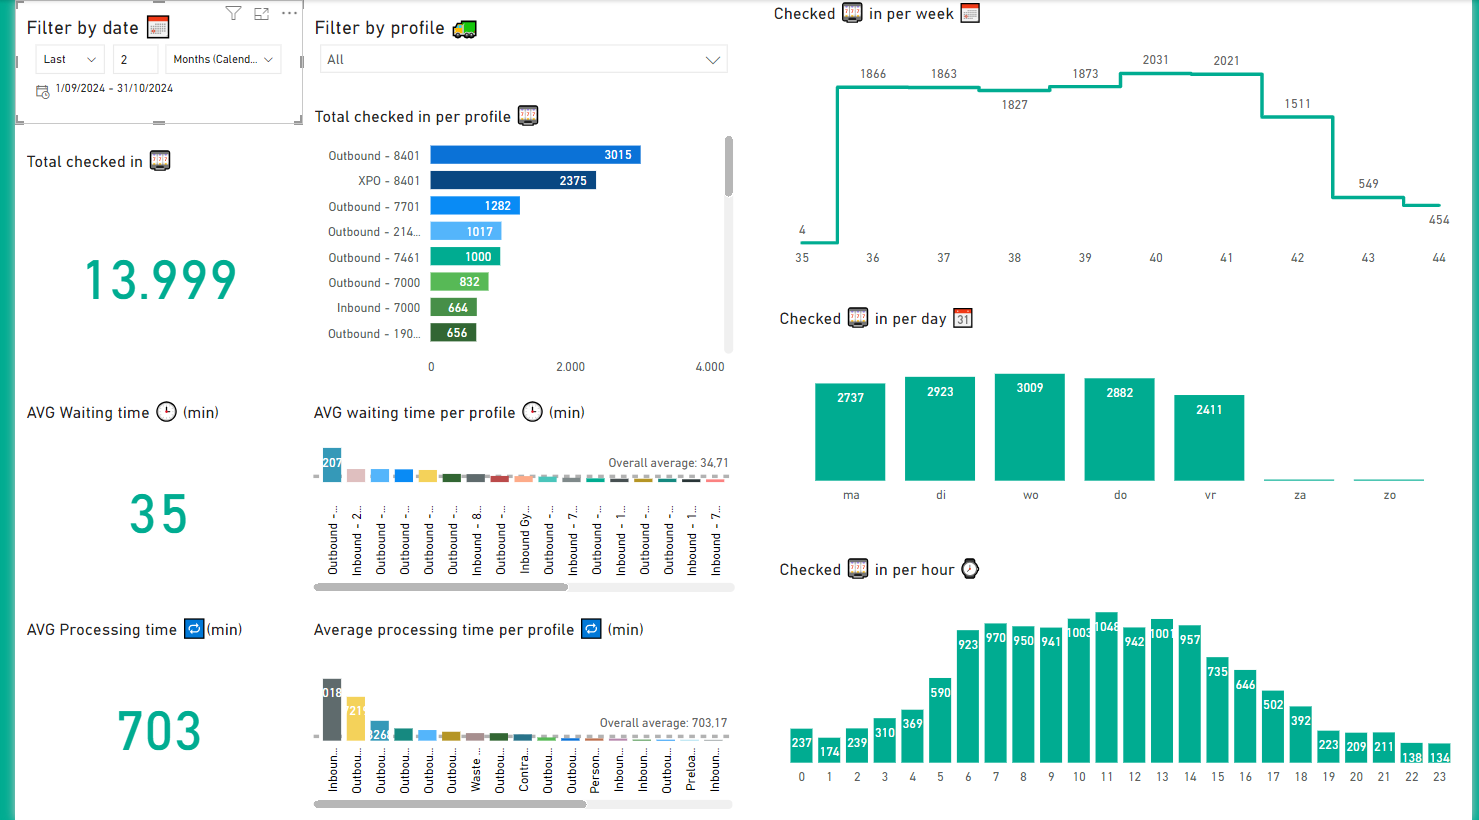
Please note that a second tab is available specifically for multi-site tenants, allowing for a comparison of site performance.
Reporting Date: Arrival Date
Throughout the report, all visitor data is mapped to the visitor's arrival date.
Won’t do / limitations
Only departed visitors
This trend report includes only visitors with a status of 'Departed.' Visitors with statuses such as 'Expected' or 'Checked-in' are not included."
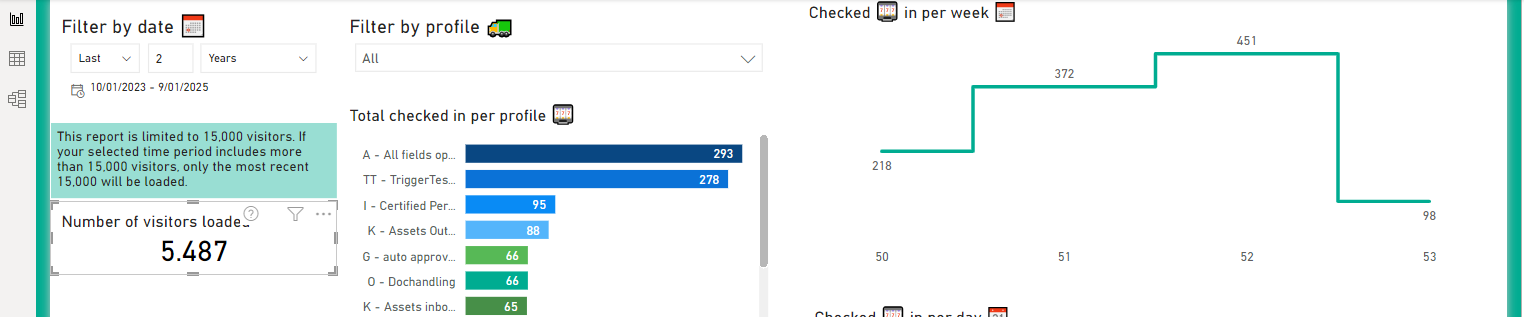
Data scope is limited to 15 000 visitors
To avoid too much impact on the load of our database, the maximum number of visitors that can be included in the scope of the data report is limited to 15 000. When trying to fetch more visitors, it will just stop after 15 000. The user will get a hint that not all visitors in the time scope could be loaded.
Less than 15 000 visitors in selected time frame (5 487) | Max number of visitors reached (warning) |
|---|---|
 | 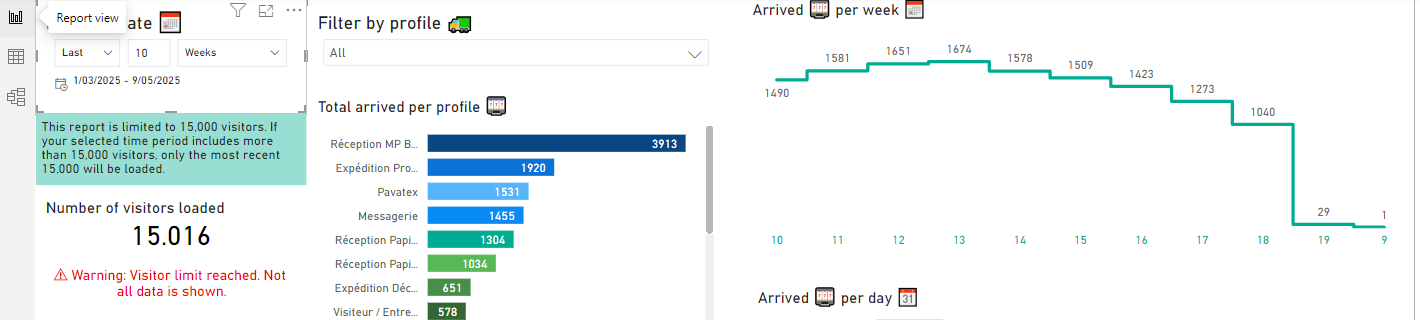 |
Troubleshooting
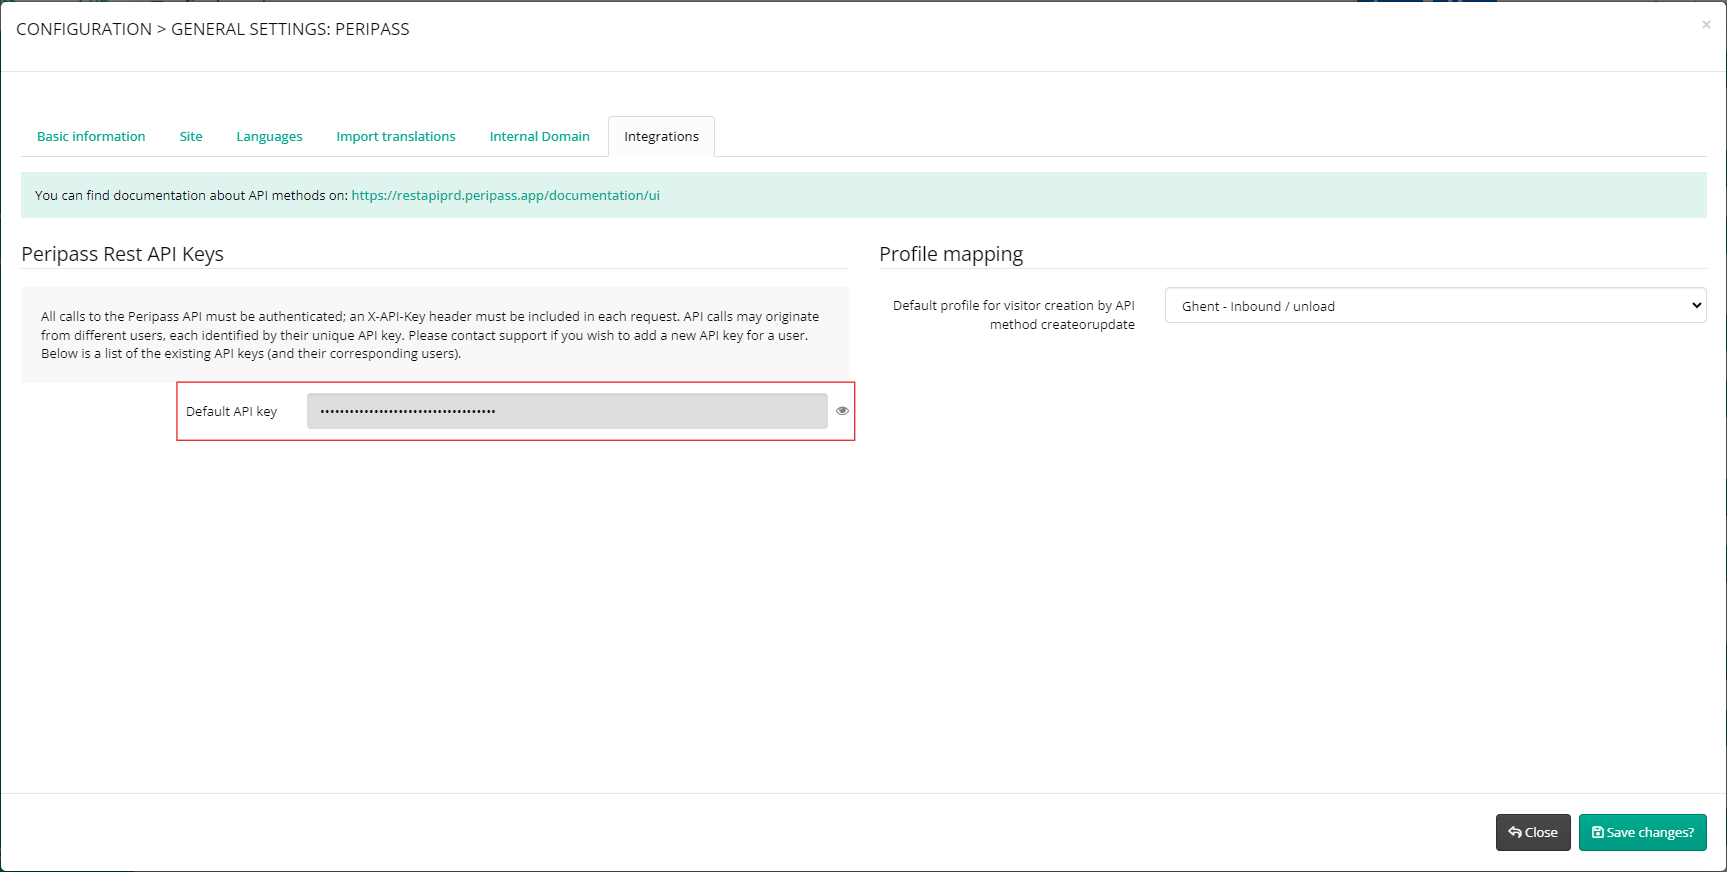
Finding your API key
In Peripass , go to “Configuration” > “General settings” > “Integrations”. Here you should be able to locate your API key.
Changing the reporting period
When you have left ‘From’ and ‘Until’ empty…
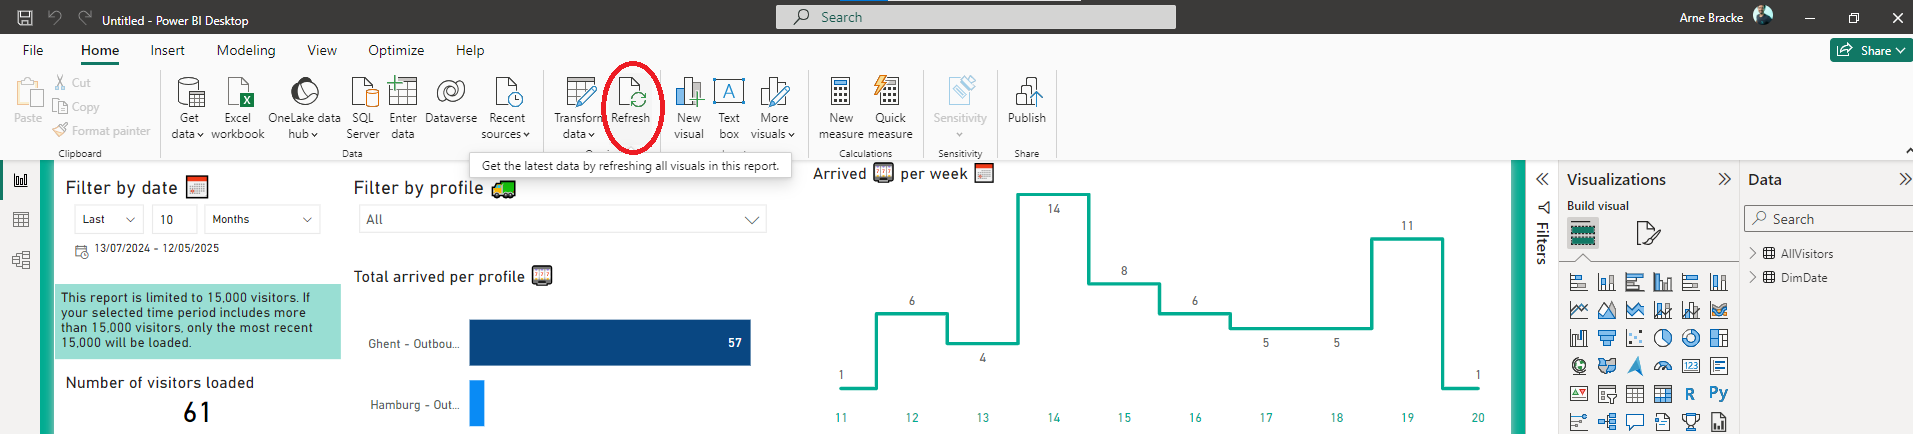
If you leave both ‘From’ and ‘Until’ fields empty, the report will automatically load data from the past 2 months by default.
Simply refresh the report, and it will display the latest available data.
When working with a custom date range
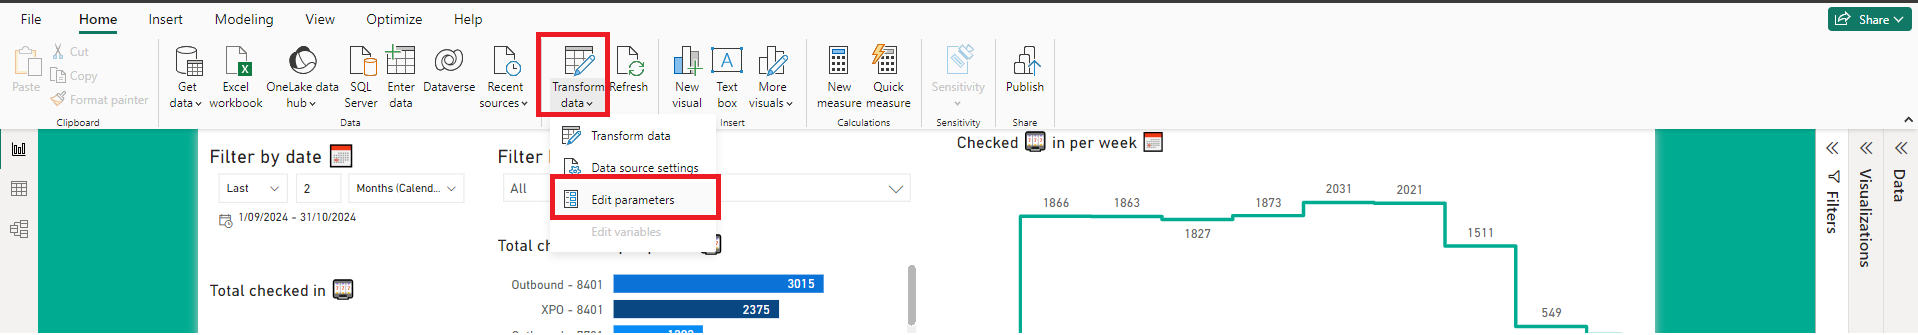
After setting the first reporting period, you can always change the period afterwards by editing the parameters as follows:
Edit the Parameters (Advanced): Update parameters directly within Power BI:
Go to Transform Data and choose Edit Parameters
Correct start or end period
The Report Is Loading but Appears Empty
There is a date filter located in the upper-left corner of the report, which is set by default to show visitors who arrived within the last 2 months. You can adjust this filter to use a different relative date range as needed.
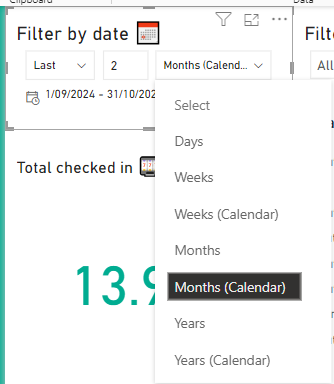
If this date filter does not align with your selected reporting period, the report may appear empty even though data exists for the chosen timeframe.